Introducing the visual network editor (tutorial)
This trail tells you how networks are created and modified by use of the mouse. You will also learn about the different types of information that are encoded in a visone network and how networks can be exported to data and image files. This trail assumes that you have already downloaded visone and that you can run the program (see the trail on installing visone).
You will probably profit the most from this trail if you start visone and directly follow the steps that are described below.
Adding nodes and links
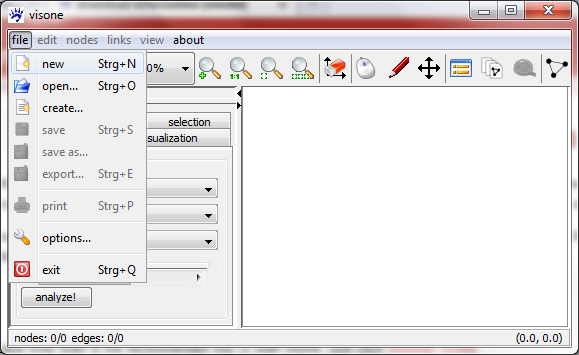
After you have started visone you see its main window. To get a network into visone you basically have three possibilities which can all be activated from the file menu.
- open allows you to open a network from a local file
- create let you generate a random network
- new opens a new empty network - that's what we are going to do now
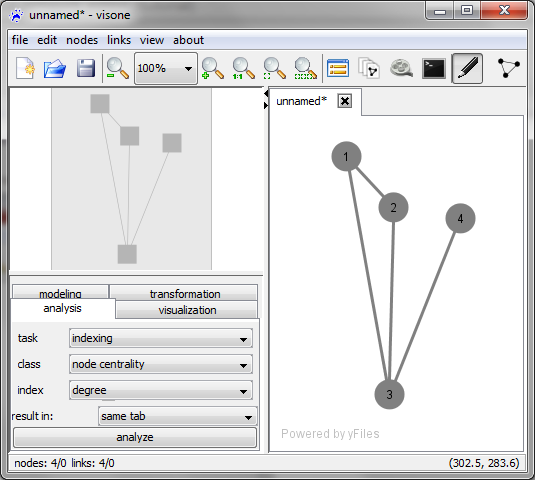
When you click on file, new a new tab labeled unnamed* opens in the network area of visone (the large part of the window aligned to the lower right corner). In this area you can add nodes and links by using the mouse:
- to add a node left-click on an empty space in the network area and release the button; repeat this maybe two or three times to add a small number of nodes
- to add a tie (a line that connects two nodes) you do the following steps:
- left-click once on a node and release the mouse button; now you've attached a tie to this node and you can drag its other endpoint around with your mouse pointer
- left-click on a second node; this attaches the free endpoint of the tie to that second node and the tie is created
- repeat this some more times to create a reasonable network
The quick layout button
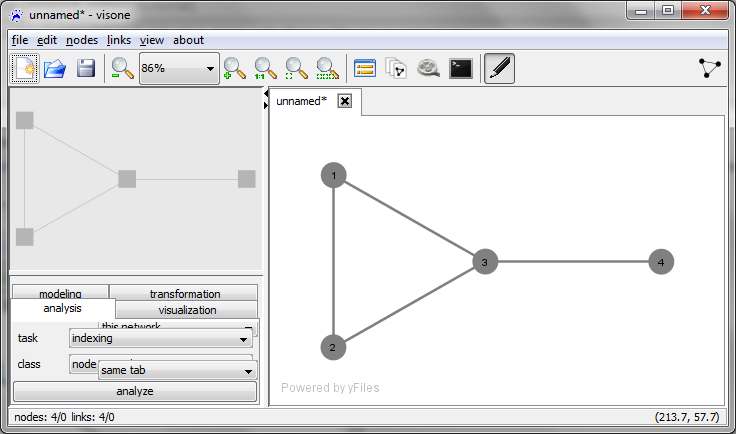
You may have already noticed that the network shown above has a very bad layout: the triangle formed by nodes 1, 2, and 3 is not symmetric and node 4 is much closer to 1 and 2 than to its neighbor 3. You could correct this manually by dragging nodes to a better position; however, this approach would turn out to be tiresome and difficult for larger networks. It saves you much time (and generally produces better results) if you compute the layout (i.e., the position of the nodes) with a layout algorithm.
The easiest way to do so is simply to click on the quick layout button ![]() shown in the upper right corner of the visone window. If you do so the structure of your network will become much more obvious.
shown in the upper right corner of the visone window. If you do so the structure of your network will become much more obvious.
visone offers more layout algorithms but if you don't have any particular reason to chose another one, the quick layout button activates the best general-purpose layout algorithm that we can offer you.
Saving the network in a file
Before we proceed to add more information to the network we'll say a few words about saving it. Remember that the network data that you have added so far is not yet saved on your computer's hard disk. As this is true for other software programs, if your computer crashes then all of your work that is not saved will be lost. visone reminds you about unsaved information by appending an asterisk (*) to the name of the network on top of the corresponding tab.
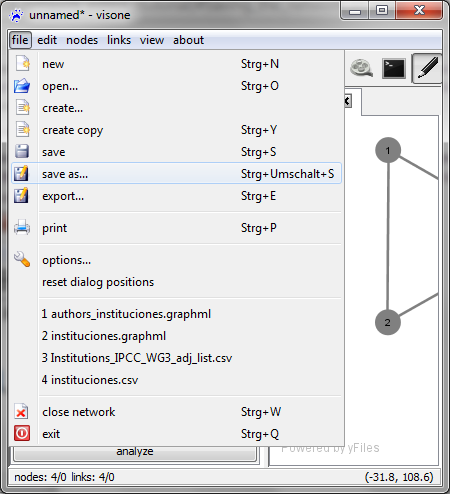
To write your data to a file, the file menu gives you three possibilities.
- save saves the network to a GraphML file whose name corresponds to the name of the network (if no name has been assigned so far, as in our situation, save will proceed to save as)
- save as also saves the network to a GraphML file but asks you first for another name (you do this, for instance, if you want to keep the former version of the network)
- export allows you to save the network to data or image files of various formats; we'll come to this point later in this trail
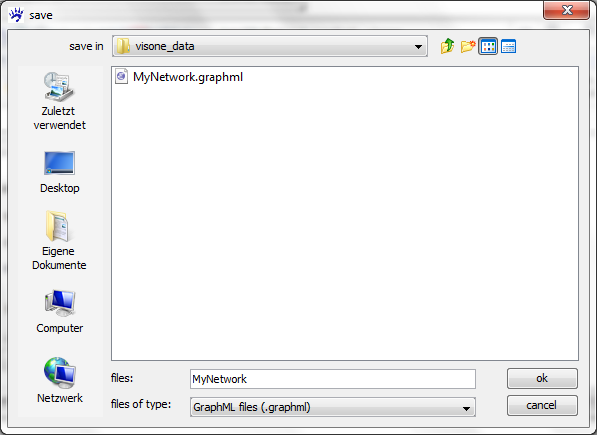
GraphML is the only format that saves all information encoded in a visone network. So, in our situation we click on file, save as, navigate to the folder of our choice in the file selection dialog, and save the network in a file whose name we can choose as we wish (MyNetwork in our example below).
After we saved the network its name appears on top of the corresponding tab. When we modify the network later, an asterisk (*) will be appended to its name, indicating that the current version contains unsaved changes. Clicking on file, save saves the current version to the same file; and so on.
Modifying node and link properties
So far we have explained how you can add nodes and links to a network. Besides this structural information, there are two more types of information encoded in a visone network: attributes and graphics. Attributes encode information associated with nodes (such as gender, age, or profession) or links (such as tie strength or type of relationship); graphical variables encode the visual appearance of nodes (e.g., color, size, x/y-position) or links (e.g., line width, color). These two types of information are conceptually different but you may choose to associate them by defining how attributes are mapped to graphical variables. How such mappings can be defined is explained in more detail in the next trail on network visualization and analysis; in the following we treat how graphical variables and attribute values can be manually changed.
Before doing this it is recommendable to switch from edit mode to analysis mode by clicking on the first of the following three icons in the toolbar:
![]()
![]()
![]() .
These three modes (analysis mode, edit mode, and navigation mode) specify how your mouse interacts with the visone GUI:
.
These three modes (analysis mode, edit mode, and navigation mode) specify how your mouse interacts with the visone GUI:
- in analysis mode
 mouse clicks select nodes or links and also clear selections; it is the usual mode that you should choose for most usage scenarios of visone
 - in edit mode
 mouse clicks add nodes and links as explained above; the edit mode is activated whenever a new empty network is opened via file, new
 - in navigation mode
 mouse clicks zoom in and out
So you should now activate the analysis mode ![]() . When you click on a node it gets selected; this is visually indicated by a slightly darker color and by small squares surrounding the node. A selected node can be dragged to another location by keeping the left mouse button down and moving the mouse pointer to the desired position. More than one node can be selected by keeping the Control-key pushed down while clicking on further nodes to select them. Selection of ties works accordingly.
. When you click on a node it gets selected; this is visually indicated by a slightly darker color and by small squares surrounding the node. A selected node can be dragged to another location by keeping the left mouse button down and moving the mouse pointer to the desired position. More than one node can be selected by keeping the Control-key pushed down while clicking on further nodes to select them. Selection of ties works accordingly.
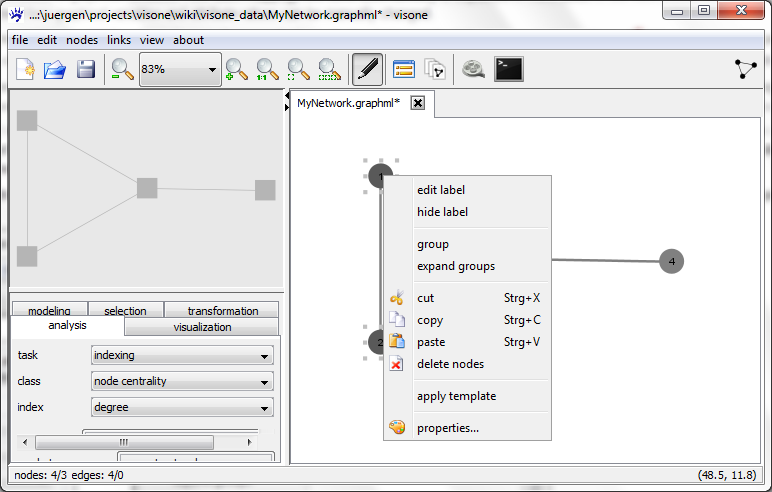
To change the information (attribute values or graphics) associated with one or several selected node(s) you first right-click on it (respectively, on one of them) to open the node context menu.
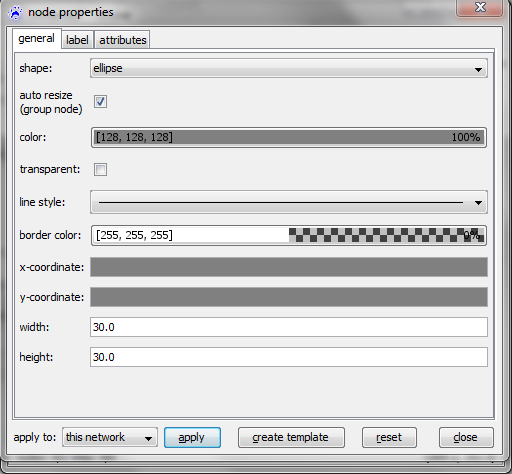
Clicking on the last item (properties...) opens the node properties dialog.
The node properties dialog has three tabs: general for changing the graphical appearance of the node, label for changing the graphical appearance of the node label, and attributes for changing attribute values (including the label text). You can explore some of the possibilities, for instance, by changing node color and shape, label size and position, and the labels themselves.
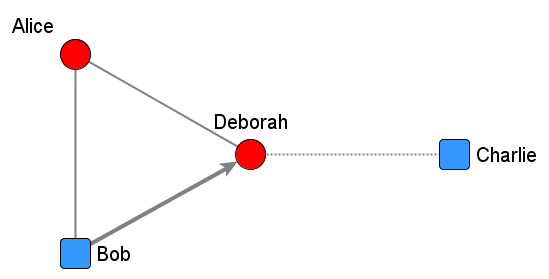
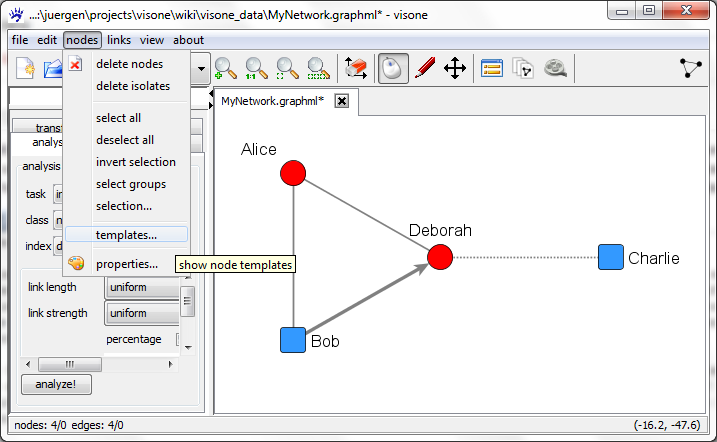
Modifying link properties works very similarly: a right-click on a link opens the link context menu, clicking on the properties option in this menu shows the link properties dialog in which you can change line color, style, width, define whether the link is directed or undirected, and much more. Together you could modify the network to look like this.
Some comments might be helpful.
- When you change the value of some field in the node properties dialog these changes do not become visible immediatelly; rather you have to click on the apply button first.
- To obtain more possibilities for chosing the label position you should first change the model in the label tab of the node properties dialog, for instance to 8 pos.
- The label text is changed by editing the value of the attribute called id in the attributes tab. (You can add more attributes to nodes or ties and you can rename attributes; this is explained later in this trail.)
Using templates and creating a legend
Typically many nodes and links in a network have the same combination of color, shape, size, etc. If this is the case it is convenient to make use of node and link templates. Templates define such combinations of graphical variables that can be applied to any selected set of nodes. Clearly this saves time and guarantees consistency, since otherwise many variables would have to be modified to change from one node style to another. Templates do also define the appearance of nodes that are later added to the network.
Node templates are defined from the node properties dialog. First the graphics of the selected node are modified to make the node look as it is desired. Then a click on the create template button in the bottom line of the dialog creates a new template that specifies the combination of graphical variables of the selected node. (When clicking on that button you don't see any change to the network.)
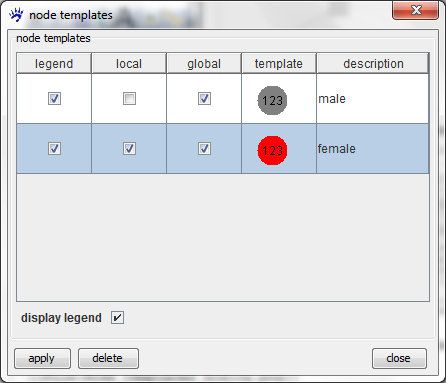
To manage the current list of templates you click on the option templates... in the nodes menu, as shown above. This opens the node templates dialog looking like this (or similar).
The template with the blue node is visone's default template. The template with the red node is the one that we have just created; it is highlighted indicating that when a new node is now added to the network it will appear as a red circle with the label above the node. (You might try this; don't forget to switch from analysis mode to edit mode before you add more nodes and back to analysis mode before you continue.)
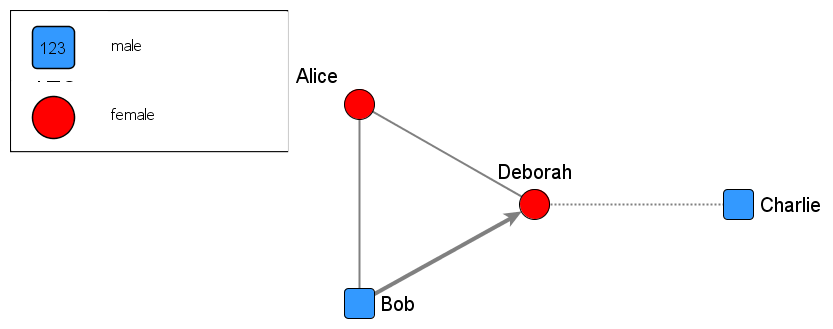
Templates can also be included in a legend, in which their meaning can be described. For instance, adding appropriate descriptions to the two templates, checking their legend boxes (check boxes on the left hand side), and checking the display legend box includes a legend to the network view looking like this.
The other options are explained in the page describing the node templates dialog.
Creating and managing link templates works accordingly.
