Visualization and analysis (tutorial): Difference between revisions
No edit summary |
No edit summary |
||
| Line 2: | Line 2: | ||
This trail assumes that you have basic knowledge about how to operate the visone [[GUI]] - as explained in the [[Introducing the visual network editor (trail)|previous trail]]. | This trail assumes that you have basic knowledge about how to operate the visone [[GUI]] - as explained in the [[Introducing the visual network editor (trail)|previous trail]]. | ||
== Introducing an examplary dataset == | |||
== Importing networks from adjacency matrix files == | == Importing networks from adjacency matrix files == | ||
Revision as of 12:53, 23 January 2011
This trail shows you how analysis and visualization goes hand in hand in visone. It introduces you to the most common usage scenario: importing data from one or several files, analyzing the network, visualizing the network together with the computed indicators, exporting data and images for further processing or publication.
This trail assumes that you have basic knowledge about how to operate the visone GUI - as explained in the previous trail.
Introducing an examplary dataset
Importing networks from adjacency matrix files
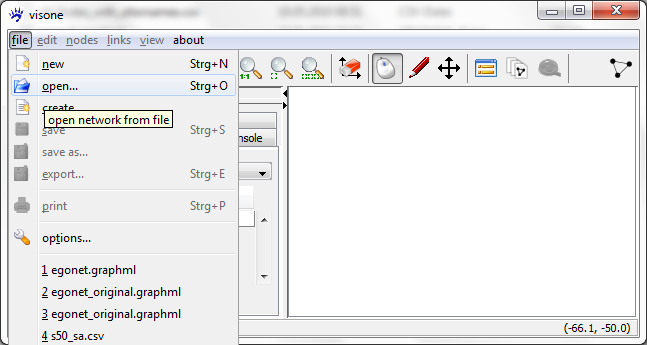
The usual way to get a network into visone is to read it from a local file via the menu file, open
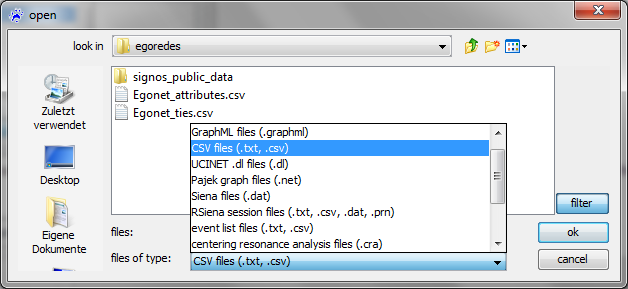
The usual file type to be read by visone is GraphML; GraphML files contain information about nodes and links, about attributes of nodes and links, and about graphical information such as layout, color, or shape. To read GraphML files you select .graphml in the file open dialog (shown below) and click on ok; this is simple, fast, and reliable.
Here, for illustration, we go the hard way and assume that the data are not stored in a GraphML file but in comma-separated-value tables. This very primitive file type can be output from many programs, including statistical software, spread-sheet editors, or other network analysis software. Sometimes you have to deal with this file type.
To open a network from an adjacency matrix file you select the type .txt, .csv in the file open dialog and click on ok. To follow the steps outlined in this trail, select the file egonet_ties.csv.
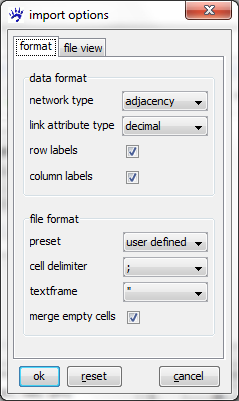
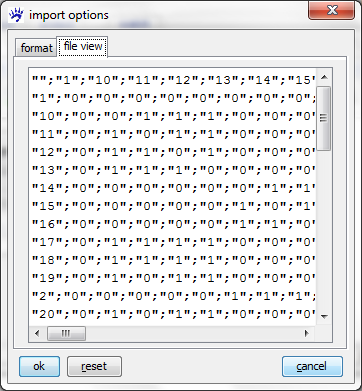
Clicking on ok does not immediatelly open the file. Indeed, in contrast to GraphML, CSV files don't have a self-explaining interpretation; rather the program that has to handle them needs some guidance. Therefore visone opens an import options dialog whose two tabs are shown below.
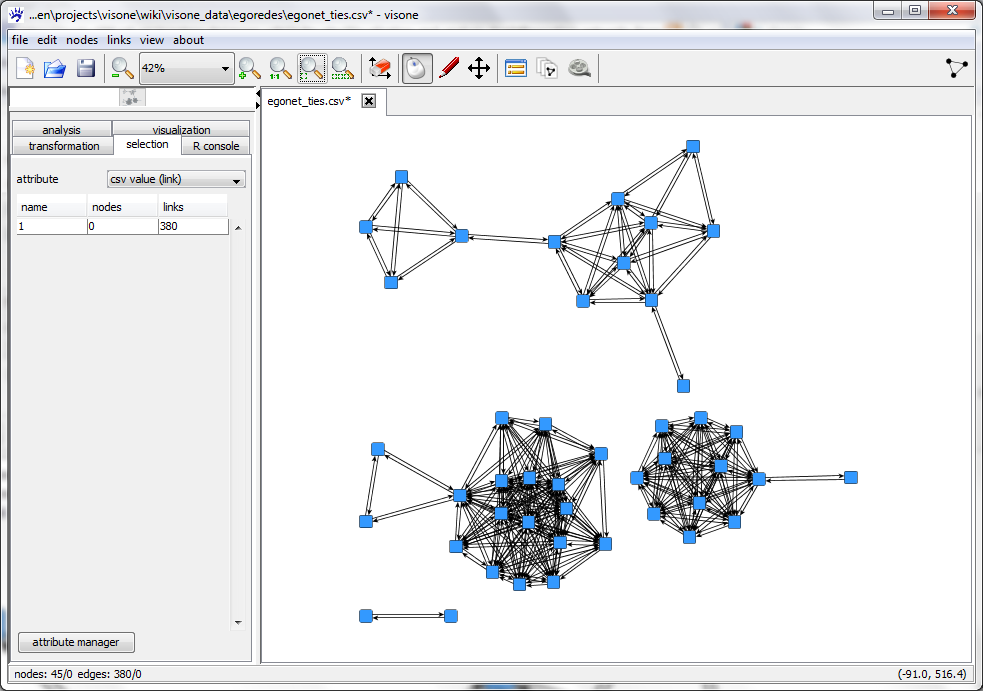
The file view tab shows you (part of) the adjacency matrix encoded in the file to be opened. From this view you can guess, for instance, that different cells in the matrix are delimited by semicolons (;), that row and column labels are present, and some more. For an exhaustive explanation of all options and their meaning see the page on the import options dialog. To continue with this trail, set all options as shown in the format tab above and click on ok. This opens a network looking like this.
The .csv does not contain layout information. The position of the nodes has been determined by the layout algorithm that can be initiated with the quick layout button.
