Wikipedia edit networks (tutorial)
The edit network associated with the history of Wikipedia pages is a network whose nodes are the page(s) and all contributing users and whose edges encode time-stamped, typed, and weighted interaction events (edit events) between users and pages and between users and users. Specifically, edit events encode the exact time when an edit has been done along with one or several of the following types of edit interaction:
- the amount of new text that a user adds to a page;
- the amount of text that a user deletes (along with the other user/s that has/have previously added this text);
- the amount of previously deleted text that a user restores (along with the users that previously deleted and the ones that originally added the text).
Together these edit events form a highly dynamic network revealing the emergent collaboration structure among contributing users. For instance, it can be derived
- who are the users that contributed most of the text;
- what are the implicit roles of users (e.g., contributors of new content, vandalism fighters, watchdogs);
- whether there are opinion groups, i.e., groups of users that mutually fight against each others edits.
This tutorial is a practically oriented "how-to"-guide giving an example based introduction to the computation, analysis, and visualization of Wikipedia edit networks. More background can be found in the papers cited in the references. To follow the steps outlined here (or to do a similar study) you should download WikiEvent - a small graphical java software with which Wikipedia edit networks can be computed.
Please address questions and comments about this tutorial to me (Jürgen Lerner).
How to download the edit history?
Wikipedia not only provides access to the current version of each page but also to all of its previous versions. To view the page history in your browser you can just click on the history link on top of each page and browse through the versions. However, for automatic extraction of edit events we need to download the complete history in a more structured format. To do this there are various possibilities that are appropriate in different scenarios (and dependent on your computational resources and internet bandwidth).
To get the history of all pages you can go to the Wikimedia database dumps, select the wiki of interest (for instance, enwiki for the English-language Wikipedia), and download all files linked under the headline All pages with complete edit history. The complete database is extremely large (several terabytes for the English-language Wikipedia) and probably cannot be managed with an ordinary desktop computer.
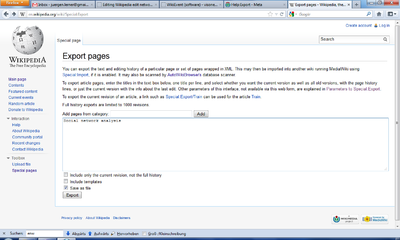
Another possibility to get the complete history of a Wikipedia page (or of a small set of pages) is to use the wiki's Export page. The preceeding link is for the English-language Wikipedia - for other languages just change the language identifier en in the URL to, for instance, de or fr or es, etc. (Actually, this visone wiki has, as any other MediaWiki, also an export page available at Special:Export; there you could download the edit history of visone manual pages - which are definitively much shorter than those from Wikipedia.)
For instance, to download the history of the page Social network analysis make settings as in the screenshot above and click on the Export button. However, as it is noted on the page, exporting is limited to 1000 revisions and the example page (Social network analysis) has already more than 2700 revisions. In principle it is possible to download the next 1000 revisions by specifying an appropriate offset (as explained on the manual page for Special:Export) and then pasting the files together. However, since this is rather tedious the software WikiEvent offers a possibility to do this automatically. (Internally WikiEvent proceeds exactly as described above by retrieving revisions in chunks of 1000 and appending these to a single output file.)
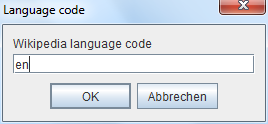
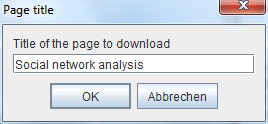
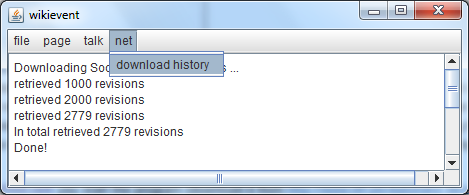
To download a page history with WikiEvent you start the program (download it from http://www.inf.uni-konstanz.de/algo/software/wikievent/ and execute by double-clicking) and click on the entry download history in the net menu. You have to specify the language of the Wikipedia (for instance, en for English, de for German, fr for French, etc), the title of the page to download and a directory on your computer in which the file should be saved.
The program is actually very silent - for instance, you don't see a progres bar - until the download is complete. The time it takes to download depends on many factors, among them the size of the page history (which might be several gigabytes for some popular pages!) and the bandwidth of your internet connection. At the end you see the number of downloaded revisions in the message area of WikiEvent.
For information: the size of the history file for the page Social network analysis is about 84 Megabytes on May 04, 2015 (obviously growing). The history is saved in a file Social_network_analysis.xml in the directory that you have chosen. If you are interested, the XML format is described in the page http://www.mediawiki.org/wiki/Help:Export - but you never have to read these files since they are automatically processed as described below.
Computing the edit network
To compute the edit events from a Wikipedia history file select the entry extract edit events in the page-menu of WikiEvent. You have to specify one or more history file(s) and a directory to save the files with the edit events. (These output files have the same names as the input files - just with the ending .xml replaced by .csv.)
If we compute the edit events from the history of the page Social network analysis, then the first few lines of the edit event file look like this:
 PageTitle;RevisionID;Time(calendar);Time(milliseconds);InteractionType;WordCount;ActiveUser;Target
 "Social network analysis";1711088;2003-09-23T21:08:52Z;1064344132000;added;196;"142.177.104.40";"Social network analysis"
 "Social network analysis";2002109;2003-11-11T06:13:44Z;1068527624000;added;10;"63.228.105.175";"Social network analysis"
 "Social network analysis";2002109;2003-11-11T06:13:44Z;1068527624000;deleted;192;"63.228.105.175";"142.177.104.40"
 "Social network analysis";2036847;2003-12-19T22:42:43Z;1071870163000;added;54;"Davodd";"Social network analysis"
 "Social network analysis";2036847;2003-12-19T22:42:43Z;1071870163000;deleted;7;"Davodd";"63.228.105.175"
 "Social network analysis";2210638;2003-12-24T13:29:11Z;1072268951000;added;1;"210.49.82.219";"Social network analysis"
 "Social network analysis";2210638;2003-12-24T13:29:11Z;1072268951000;deleted;1;"210.49.82.219";"Davodd"
 ...
The file encodes a table with entries separated by semicolons (;). The columns from left to right encode
- The title of the page (since a history file can contain the history of several pages the title-field can actually vary.).
- The revision id which is a number uniquely identifying a revision in Wikipedia (not just in one page). A single edit can produce more than just one line in the output file (we say more on this below); the revision id makes it possible to recognize which lines belong to the same edit.
- The time of the edit given as a date/time-string. For instance the first edit happend on September 23, 2003 at 21:08:52 (where time is measured in the UTC time zone).
- Once again the edit time given as a number encoding milliseconds since January 1, 1970 at 00:00:00.000 Greenwich Mean Time. (This value is actually obtained by the method
getTimeInMillisof the java classCalendar.) The time in milliseconds is helpful if you just need the time difference between revisions and not the actual time or date; it is obvisously easier to compute the time difference from numbers than from data/time strings. - The edit type which can be added, deleted, restored, or undeleted; we say more on this below.
- The word count, i.e., the number of words that are added, deleted, restored, or undeleted with respect to the given target.
- The active user is the user that has done the edit; it is the source node of the edit event. The user is identified by a user name if logged in; otherwise (if it is an anonymous edit) the user is identified by an IP address.
- The target node of the edit event is either the page or a user. If the event type is added, then the target is the page (the active user adds text to the page). If the event type is deleted, restored, or undeleted, then the target is the user who has previously written or deleted the text (the active user deletes/restores/undeletes text that has been added/deleted by the target user).
We say more on the different event types in the following.
The structure of edit network data
Consider an example of three revisions on one page where
- (in Revision 1) user Alice adds some new text to the page;
- subsequently (in Revision 2), user Bob deletes this text;
- then (in Revision 3), user Charlie reverts Bob's edit - setting back the page text to the one submitted in Revision 1.
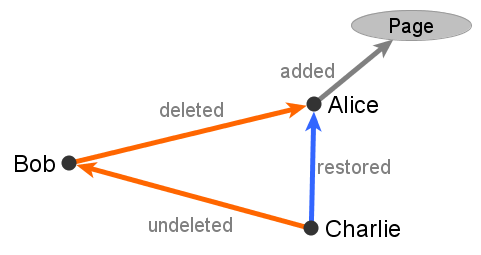
These three edits together give rise to four dyadic edit events (shown in the image below):
- An edit event of type added from user Alice to the edited page.
- An edit event of type deleted from user Bob directed to user Alice.
- An edit event of type restored from user Charlie directed to user Alice (Charlie restored text that has been previously written by Alice).
- An edit event of type undeleted from user Charlie directed to user Bob (Charlie restored text that has been previously deleted by Bob). Note that after the revert the restored text is (again) authored by Alice and not by Charlie.
All edit events are weighted by the number of words that have been added, deleted, restored, or undeleted and all edit events have a time stamp marking the time when the edit has been submitted.
A single edit on a Wikipedia page generates one hyperedge linking the active user to (potentially) several other users and the edited page. Such a hyperedge has been turned into several lines of the CSV file, each encoding one (dyadic) edge, linking the source (active user) to one target in one interaction type. Note that the hyperedges can be reconstructed from the data using the revision ids (see above).
For determining the amount of text modified in an edit we make some choices. For instance, if complete sentences are just moved from one part of the page to another, we do not count this as any change. More detailed information about the text-processing conventions can be found in
- Ulrik Brandes, Patrick Kenis, Jürgen Lerner, and Denise van Raaij: Network Analysis of Collaboration Structure in Wikipedia. Proc. 18th Intl. World Wide Web Conference (WWW 2009).
and more technically in
- Ulrik Brandes, Patrick Kenis, Jürgen Lerner, and Denise van Raaij: Computing Wikipedia Edit Networks. Technical Report, 2009.
For convenience, we make the computed edit events available for download in the file Social_network_analysis.zip.
Importing edit event networks into visone
The CSV file with the computed edit events can be imported in visone when opening it as an event list file. Visone's capabilities in importing and analyzing event networks are documented in the tutorial on event networks; here we treat the special case of edit event networks.
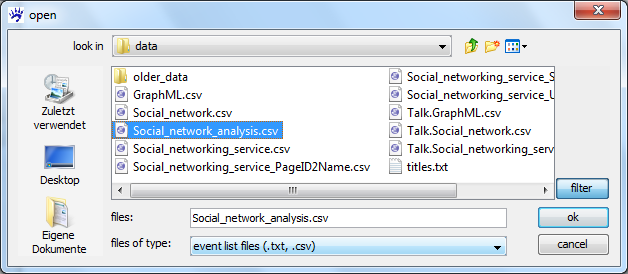
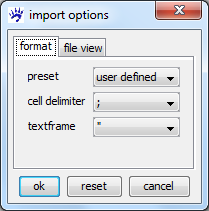
To open an event list file (such as the newly created Social_network_analysis.csv) click on open in visone's file menu, select files of type: event list files, navigate to the CSV file, and click on ok. In the import options, choose the semicolon (;) as a cell delimiter and double quotes (") as textframe.
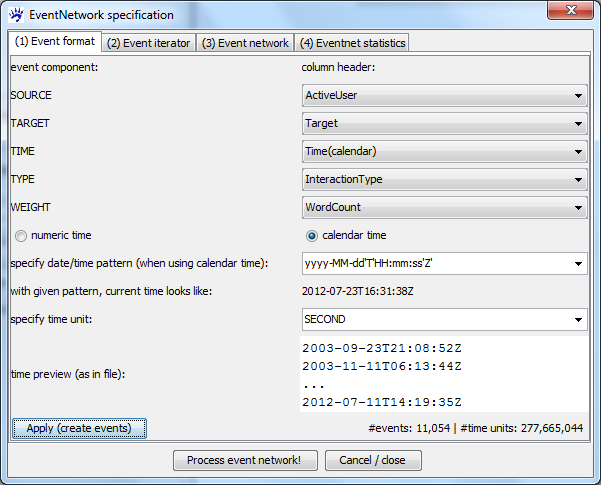
visone can now read the various entries of the input file - and you have to specify how these should be mapped to the resulting network in the dialog EventNetwork specification (shown below). Concretely you have to specify how the various components of an event are encoded in the file (Event format tab); how to iterate over the network sequence (Event iterator tab); how the events are mapped to the network's link attributes (Event network tab); and, if desired, which statistics should be computed while constructing the event network (Eventnet statistics tab). The tabs should be filled out in the order as they are numbered in the dialog since choice-possibilities for the latter tabs depend on previous settings. If you make changes in some tab you have to subsequently set (again) the values for the latter tabs.
Event format
In the event format tab (see the image below) you first have to specify which columns of the input file hold the information about the five components of an event (source, target, time, type, and weight). You can set the values as in the image below.
After these five components have been chosen visone needs some information about the interpretation of time. (visone can handle very general date/time formats - but some information is necessary.) The first choice is the selection between numeric time (if the time fields correspond to integer numbers) or calendar time (if time fields can somehow, specified below, be turned into a date/time). We have calendar time in our example.
If time is given by calendar, a time format pattern has to be specified. visone proposes some known pattern - among others the pattern yyyy-MM-dd'T'HH:mm:ss'Z' which is appropriate for the Wikipedia edit times. You can enter other than the proposed patterns in the textfield if date/time is formatted differently (see the webpage on the java class SimpleDateFormat for guidance). visone assists you in finding the right pattern by showing some date/time strings as they appear in the file and - whenever you select a date format pattern - the dialog shows you the current time formatted by the specified pattern.
Finally, you have to specify a time unit. If time is numeric you have to enter a (integer) number in the textfield. If time is given by calendar you can select a "natural" time unit from Millisecond to Year. An appropriate time unit makes the iteration over the event sequence (and potentially the decay of link attributes over time) more intuitive. When computing event network statistics, events that happen within the same time unit are treated as independent of each other. The finest time unit that makes sense for the Wikipedia edit events is Second (since the edit times are not given with higher precision). But you could also choose Day as a time unit if you think that this is fine-grained enough.
When all settings in the event format tab are done, you can create the list of events by clicking on the Apply (create events) button. A message informs about the number of events and the number of time units from the first to the last event.
Event iterator
In the event iterator tab (see below) you have to specify the start and end time of the time interval to be processed and the delay between network snapshots.
When the events have been created after filling out the event format tab (see the preceeding section) visone suggests as start time the time of the first event and as end time the time of the last event. If you don't want to process the whole event sequence you can increase the start time and/or decrease the end time. After clicking on the upper Apply / get info button, visone informs you about the number of events and time units in the specified subsequence. You might just take all events by not changing the interval borders; this includes all events from September 23, 2003 to July 11, 2012 - as can be seen in the dialog.
Then you have to choose the time points when a network snapshot is to be created by specifying the delay between snapshots. You can see in the dialog that the event sequence spans more than 277 million time units (i.e., seconds with the current settings). The number of snapshots must be small (some 10 or 20 snapshots would still be ok), since they are all opened in a new tab in visone. When specifying: create snapshots after every 100,000,000 time unit(s), then visone creates three snapshots. (This is an example where a coarser time unit might be more intuitive; 100 million seconds are actually a bit more than 1157 days.) visone always creates one snapshot at the end of the event sequence - even if the waiting time is less than the specified number.
Note: Do not click on Process event network before you specify the event network in the next step.
Event network
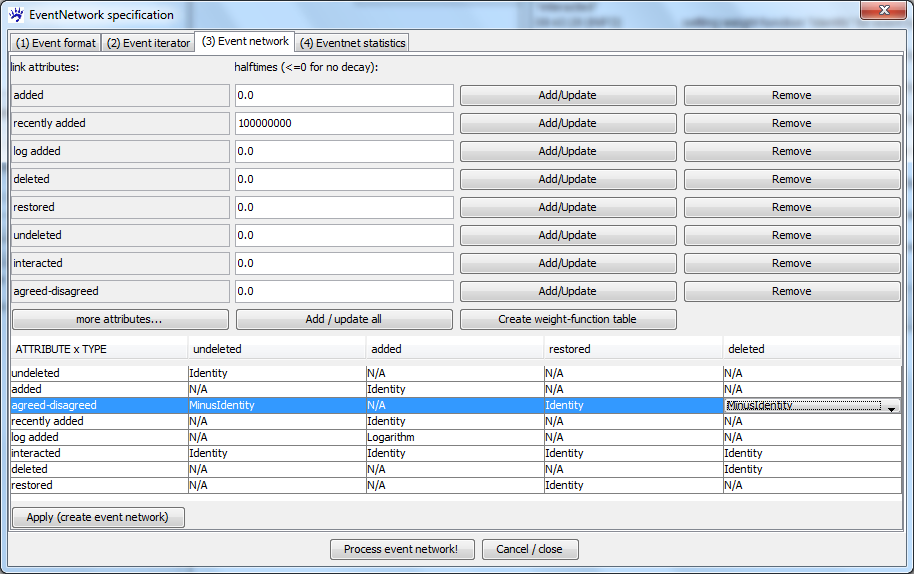
The tab to specify the event network is the most important one - here you define which link attributes of the event network summarize the past events, how events of various types add to these attributes, and how they change over time. The dialog might seem a bit complicated at first glance but the mechanism to specify the evolution of the event network is very powerful and general.
The first thing to do is to decide on the link attributes. Here you are free to choose any attribute name (that makes it easy to remember the intuition of the attribute). Furthermore, a halftime - defining how fast attributes decay over time - has to be specified. The halftime has the following effect: when a particular link attribute on a particular dyad (pair or actors) has a value of at time , then (if no event on the same dyad happens in between) the value is at time . Intuitively, link attributes with a positive halftime capture recent interaction. A halftime equal to zero or negative indicates that the respective attribute does not decay over time; these attributes capture past interaction irrespective of the elapsed time.
In our concrete example we choose the following link attributes.
- The attributes added, deleted, restored, and undeleted just add up the weight (i.e., the number of words modified) of past events of the respective type (with no decay). For instance, the value of the attribute added on a link connecting user U with page P at time t is equal to the number of words that U contributed to P at or before time t. Similarly, the value of deleted on a dyad (U,V) is equal to the number of words that user U deleted of text previously written by user V.
- The attribute recently added counts words added by users to a page but has a decay over time. If we choose as halftime the same value as for the interval between snapshots, then 100 words added just at the end of the first interval (say) contribute with a value of 50 at the end in the second snapshot. (It is also possible to introduce attributes like recently deleted, etc; and it would also be possible to have varying halftimes to capture very recent interaction, recent interaction, more distant interaction, etc., in the same event network.)
- The attribute log added adds up the logarithm of the number of newly contributed words. A logarithmic transformation is appropriate in very skewed event weights (when, say, twice the number of words should not count twice as much but only slighly more). Other transformations of event weights are also possible.
- The attribute interacted adds up the number of modified (added, deleted, restored, or undeleted) words irrespective of the event type.
- The attribute agreed-disagreed is meant as a proxy for whether a user agrees or rather disagrees with the edits of another user. Specifically, deletions and undeletions are interpreted as disagreements since a user makes another user's edits undone; restoring text is interpreted as an agreement. (This indicator is proposed and used in the published papers cited in the references but will also become clearer in this tutorial.)
At the beginning the dialog has two rows for two different link attributes; more can be added by clicking the more attributes ... button. When all attributes are specified they have to be added to the event network (for instance by clicking the Add / update all button). Then you can create the weight function table.
In the weight function table there is one column for every event type and one row for every link attribute. A particular entry in this table specifies how events of the column type contribute to the link attribute in the respective row. The entries are combo boxes allowing you to select from the available weight functions. For instance, selecting the weight function Identity for the attribute deleted and the event type deleted implies that the weight (i.e., the number of words) of events of type deleted are added (without transforming them) to the link attribute deleted. The weight function Logarithm for the attribute log added and the event type added implies that the logarithm of the event weight is added. Note that in the row corresponding to the attribute interacted we add up the weights of all event types; for the attribute agreed-disagreed we add weights of events of type restored and subtract (chose the weight function MinusIdentity) weights of events of type deleted or undeleted.
When these settings are complete you can process the event network. (You need to fill out the event statistics tab only when you want to do a statistical analysis of the event network - this is documented in a latter section: Wikipedia_edit_networks_(tutorial)#Statistical_modeling_of_edit_event_networks.) After clicking on the button Process event network! it takes a few minutes or so (depending on the size and number of the snapshots). With our settings we create three network tabs holding the three snapshots. The dialog does not close after processing; you might change some of the settings and create different snapshots - or close the dialog explicitly.
For convenience, we make the GraphML file of the first snapshot available for download in Social_network_analysis_(raw).graphml.zip.
Analysis and visualization of edit networks
The created network snapshots have nodes representing the page (or pages, if there are several in the history file) and all users that contributed at or before the time of the snapshot. The link attributes encode (in our case) the number of words added, deleted, restored, undeleted, or modifications thereof (as explained before) - again taken at the snapshot time. Analysis and visualization works similar as for any other network with many numerical link attributes. In particular, many of the derived user attributes that have been proposed in Ulrik Brandes, Patrick Kenis, Jürgen Lerner, and Denise van Raaij (2009): Network Analysis of Collaboration Structure in Wikipedia can be computed and visualized by visone starting from the available link attributes. Examplarily we illustrate some possibilities with the first snapshot, the smallest one, that has 412 nodes and 1341 links.
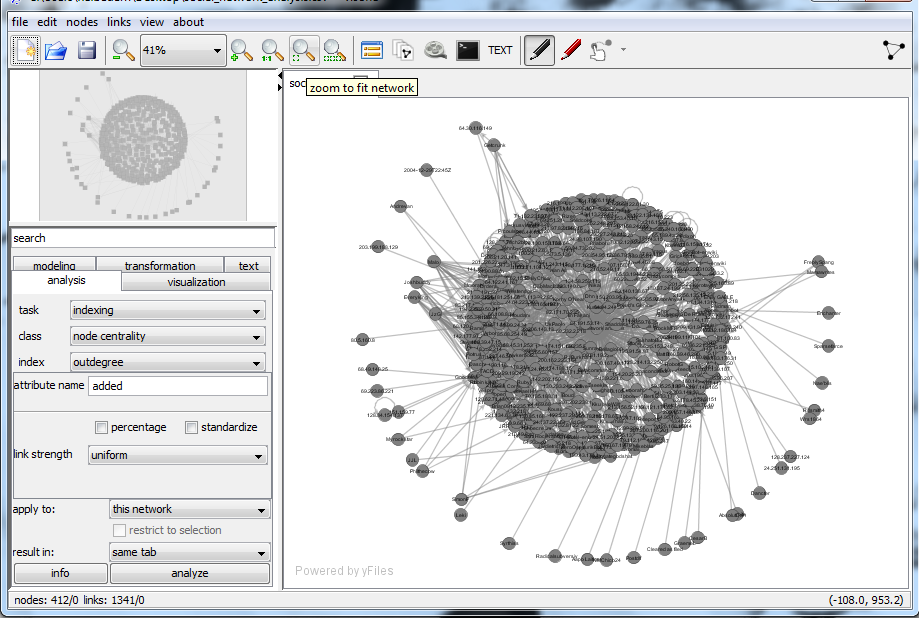
The first observation is that the layout after loading is very cluttered. Actually, all user-nodes that added at least one word to the page (Social network analysis) are at a distance of two or smaller - leading to the very dense circle around one very central node. An improvement can be achieved by deleting the node representing the page - after some information has been collected in the (user-)nodes. Therefore, go to the analysis tab select the node outdegree with link strength set to the link attribute added and save it in a node attribute added (see the screen shot below). Do the same again with the attribute log added.
To delete the single node representing the page we have to select it first. This can be done by selecting the single node with the label equal to Social network analysis in the Attribute manager; or (more generally since it is applicable to networks with several page-nodes) we compute the unweighted outdegree and select all nodes with outdegree equal to zero - these are exactly the nodes representing pages.
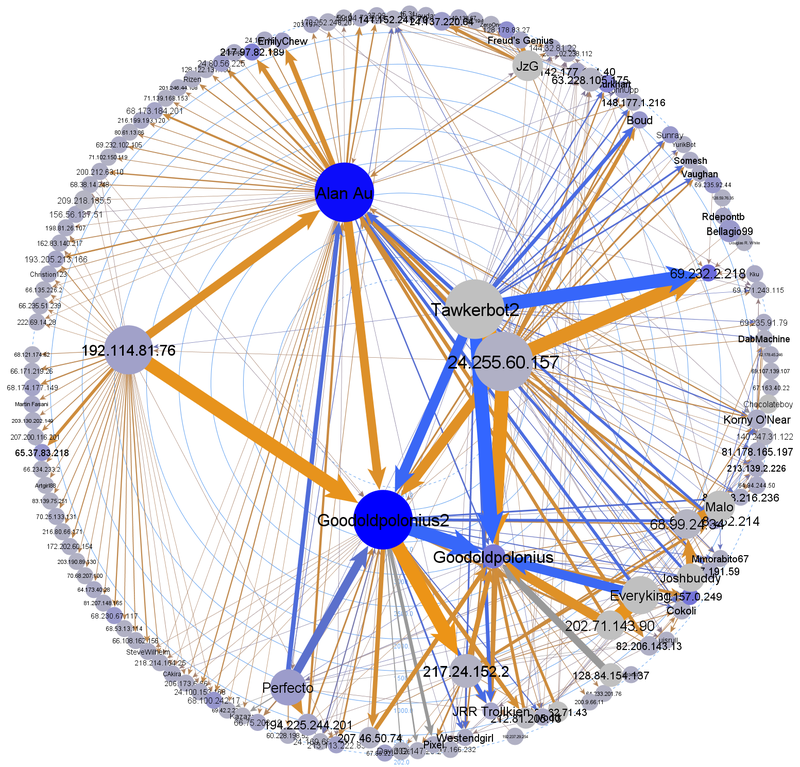
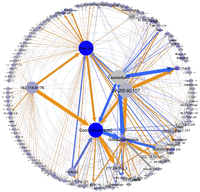
After having deleted the node representing the page, reducing to the largest connected component, and computing and visualizing some additional indicators, we can come up with an image as the following.
Here the color of the nodes represent the amount of text added (blue for those who added a lot). The size of the nodes as well as the centrality of their position and the node label size represent the activity of the nodes - computed from the interacted attribute (note that this includes adding, deleting, restoring, or undeleting text). The width of the links is again a function of the interacted attribute. Finally the link color is tending to orange if the agreed-disagreed attribute admits strongly negative values (resulting from deletion or undeletion and being interpreted as disagreement) and the link color is tending to blue when the agreed-disagreed attribute becomes larger (being interpreted as agreement).
Many other ways to graphically encode these and other indicators are possible.
For convenience, we make the GraphML file of the first snapshot with an improved layout available for download in Social_network_analysis.graphml.zip.
Statistical modeling of edit event networks
While importing event networks it is possible to compute and save network statistics associated with dyadic events that can be used to build and estimate a statistical model for the conditional event type. Such models have been proposed in Ulrik Brandes, Jürgen Lerner, and Tom A. B. Snijders (2009): Networks Evolving Step by Step: Statistical Analysis of Dyadic Event Data and applied to Wikipedia edit networks in Jürgen Lerner, Ulrik Brandes, Patrick Kenis, and Denise van Raaij (2012): Modeling Open, Web-based Collaboration Networks: The Case of Wikipedia. These models can be used to test whether the network of past edit events explains the likelihood of future deletions or undeletions, for instance
- Do users have a tendency to delete the edits from users who deleted them previously?
- Do the deletion/undeletion events give rise to patterns of structural balance?
(Note that the functionality for statistical analysis of event networks has been superseded by the event network analyzer (eventnet), which is a separate software that is not restricted to the analysis of the conditional event type and offers much more general settings. We nevertheless keep the description below how to perform a statistical analysis of event networks with visone.)
The event network statistics can be computed during importing the data, are saved in a file, and can then be analyzed with any statistical software, such as R.
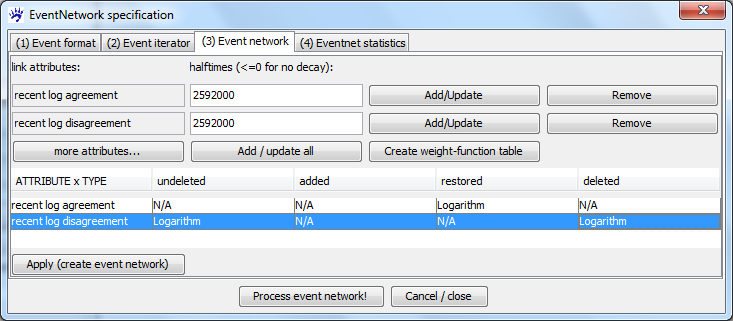
To illustrate how such statistics can be computed and modeled we modify the link attributes in the event network tab (see below). (The settings in the event format and event iterator tabs stay the same.)
Specifically, we define only two attributes, one that measures past agreement (a fuction or events of type restored) and one the measures past disagreement (a function of events of type deleted or undeleted). The halftime of both attributes is set to 30 days (which is 2592000 seconds) and the event weights (word counts) are logarithmically scaled.
Specifying event statistics in the eventnet dialog
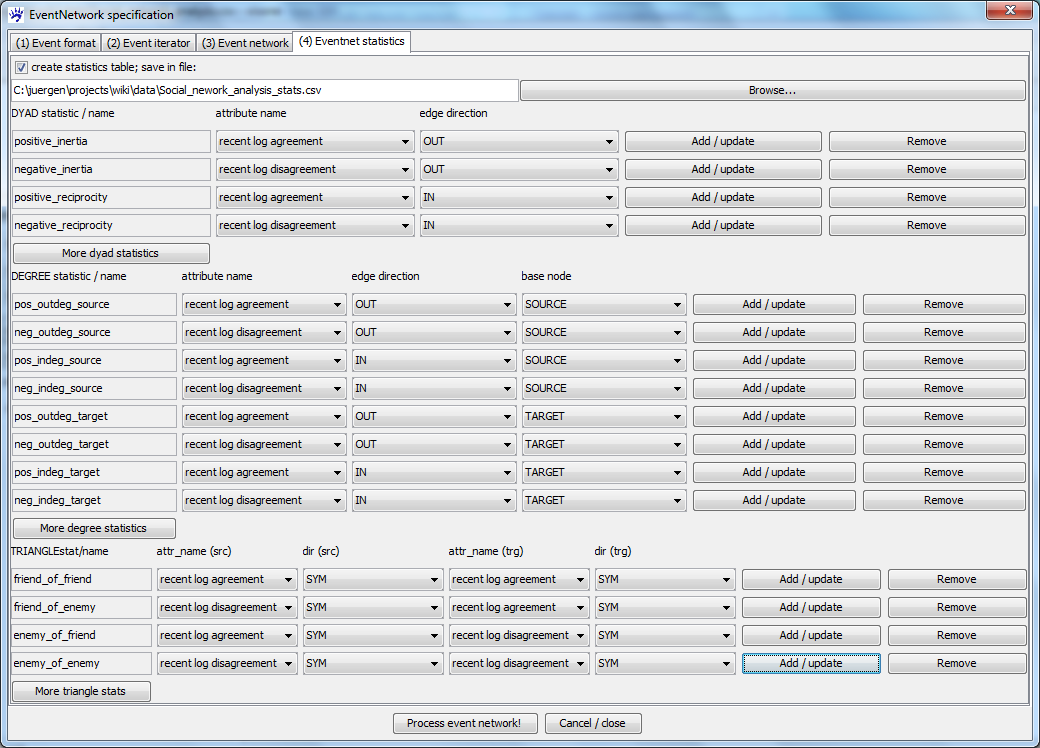
The statistics to be computed are defined in the eventnet statistics tab of the import dialog (see below). You first have to specify whether a statistic table should be created at all; if yes an output file has to be chosen and one or more statistics have to be defined.
The statistics are used to model events in the following way: whenever an event happens that is initiated by a source node and directed to a target node, then the dyad (source, target) is embedded in the network of past events, i.e., all events that happened before the current event. The event network statistics describe relevant aspects of this network of past events with respect to the specific dyad. visone offers three different types of statistics - dyad statistics, degree statistics, and triangle statistics - that can be varied with respect to edge direction and/or link attributes. After defining the statistics they have to be added to the event network by clicking on the Add / update button.
Dyad statistics
Dyad statistics encode aspects of the past events from source to target or in the other direction. That is the dyad statistics encode how source interacted with target in the past and how target interacted with source. In our exmple we define four different dyad statistics that are obtained by switching the direction (inertia if OUT-going events - from source to target - are considered and reciprocity if IN-coming events - from target to source - are considered) and the link attribute (positive for past agreements and negative for past disagreements).
Intuitively, if users tend to delete text of those that deleted them, then we expect that the negative reciprocity statistic is positively related with the likelihood that the edit event is of type deleted.
Degree statistics
Degree statistics summarize the past events around the dyad (source, target) by the weighted (out-/in-) degree of source or target. The links can be weighted by any attribute. For instance, the neg_outdeg_source statistic adds up the values of the disagreement attribute on all links starting at the source node (not only those that are directed to target).
Intuitively, if users that deleted a lot in the past tend to delete in the future, then we expect a positive relation between the neg_outdeg_source statistic and the likelihood that the edit event is of type deleted. This could point to the presence of users that play specific roles, for instance, "vandalism fighters" that undo malicious edits.
Triangle statistics
Triangle statistics summarize the network of past events around the dyad (source, target) by weighted indirect relations from source over any third node to target or the other way round. You can select the attributes for the links attached to source and to target and the direction which can be OUT (only out-going ties with respect to the source/target), IN (only in-coming ties), or SYM (adding up the attributes of out-going and in-coming ties).
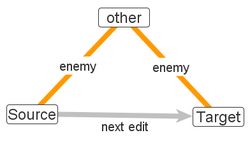
For instance, the statistic enemy_of_friend iterates over all users U in the network, multiplies the value of the agreement attribute on links connecting source and U (in both directions) with the value of the disagreement attribute on links connecting target and U (in both directions), and adds up these products for all U. Intuitively, the value of the enemy_of_friend statistic on the dyad (source, target) is high if there are many other users U that are in agreement with source and in disagreement with target; structural balance theory predicts that source is then more likely to disagree with target.
Starting the computation
Once the output file and the statistics are specified, click on the Process event network! button. Snapshots are created as defined in the event iterator tab and statistics are computed as defined in the eventnet statistics tab.
Note that statistics associated with an event that happens at time t are only a function of events that happend earlier (strictly before t) - and do not depend on events that happen in the same time unit.
The computed eventnet statistics file (Social_network_analysis_stats.csv in our example) is a table in CSV format in which each row corresponds to one event of the input file. The components of the event (source, target, time, type, and weight) are first repeated in each row - followed by the values of all statistics.
Modeling the conditional event type
The statistics file can now be analyzed with any statistical software - we describe the following for the R environment for statistical computing (also see the visone tutorial on the R console).
First set the R working directory to the directory where the statistics file is located, for instance
setwd("c:/juergen/projects/wiki/data/")
To read the file into a table and see some summary statistics type
 eventnet.stats <- read.csv("Social_network_analysis_stats.csv", sep=";")
 summary(eventnet.stats)
For modeling the likelihood whether an edit is an undo edit we create a new binary variable is.undo that is equal to 1 if and only if the edit type is deleted or undeleted.
 eventnet.stats$is.undo <- 0
 eventnet.stats$is.undo[eventnet.stats$TYPE == "deleted"] <- 1
 eventnet.stats$is.undo[eventnet.stats$TYPE == "undeleted"] <- 1
 summary(eventnet.stats)
We remove those events that are of type added (since these are interactions between users and the page).
eventnet.stats <- eventnet.stats[eventnet.stats$TYPE != "added",]
Further we model only those events that are not self-loops.
eventnet.stats <- eventnet.stats[as.character(eventnet.stats$SOURCE) != as.character(eventnet.stats$TARGET),]
A first very simple model is a logit model for the probability that an edit from source to target is an "undo" edit - explained by the past deletions in the other direction (that is from target directed to the source node).
 model.1 <- glm(is.undo ~ 1 + negative_reciprocity, family = binomial(link=logit), data = eventnet.stats)
 summary(model.1)
A summary of the estimated model yields (among others) the following output:
 glm(formula = is.undo ~ 1 + negative_reciprocity, family = binomial(link = logit), data = eventnet.stats)
 Coefficients:
                      Estimate Std. Error z value Pr(>|z|)
 (Intercept)           0.49213    0.02175  22.630  < 2e-16 ***
 negative_reciprocity  0.61765    0.20475   3.017  0.00256 **
 ---
 Signif. codes:  0 ‘***’ 0.001 ‘**’ 0.01 ‘*’ 0.05 ‘.’ 0.1 ‘ ’ 1
The interpretation is that there seems to be a habit of "retaliate" deletions: if target has undone edits of source then there is an increased probability (postitive coefficient for the negative_reciprocity statistic) that source makes edits of target undone.
A more complex model tests for structural balance effects
 model.2 <- glm(is.undo ~ 1 +  friend_of_friend + enemy_of_friend +
                               friend_of_enemy + enemy_of_enemy,
                               family = binomial(link=logit), data = eventnet.stats)
leading to the following estimates.
 Coefficients:
                  Estimate Std. Error z value Pr(>|z|)
 (Intercept)       0.46288    0.02270  20.393  < 2e-16 ***
 friend_of_friend  0.05798    0.08871   0.654  0.51340
 enemy_of_friend   0.20675    0.07022   2.945  0.00323 **
 friend_of_enemy   0.92448    0.10156   9.102  < 2e-16 ***
 enemy_of_enemy   -0.18435    0.02766  -6.666 2.63e-11 ***
 ---
 Signif. codes:  0 ‘***’ 0.001 ‘**’ 0.01 ‘*’ 0.05 ‘.’ 0.1 ‘ ’ 1
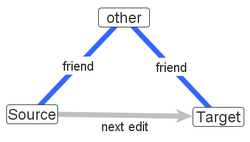
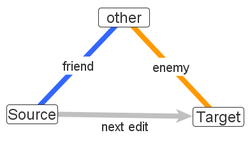
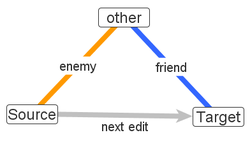
The interpretation of the estimated coefficient is as follows (also see the four illustrative images below).
The coefficient associated with the enemy_of_friend statistic is significantly positive. This implies that there is an increase probability for source undoing an edit of target if target has past disagreements with another user with which source has past agreements (second image in the row above). A similar effect has been found if target has past agreements with another user with past disagreements with source (positive parameter associated with the friend_of_enemy statistic and third image in the row above). The parameter associated with enemy_of_enemy is significantly negative; this implied that if both, source and target have past disagreements with a common other node (forth image), then they have a decreased probability of undoing each others edits. While these three effects are in line with the predictions of structural balance theory, there is no significant parameter associated with the friend_of_friend statistic (first image in the row above).
See more on structural balance theory in the context of Wikipedia edit networks in Jürgen Lerner, Ulrik Brandes, Patrick Kenis, and Denise van Raaij: Modeling Open, Web-based Collaboration Networks: The Case of Wikipedia.
The network of simple edit events
The WikiEvent software offers the possibility to compute simple edit events from a (potentially huge) set of Wikipedia pages. A simple edit event is a directed, time-stamped event from a user U to a page P encoding that U made some edit on page P at the given time point. Simple edit events do not encode the type of an edit, nor the amount of text changed, nor the other users whose text has been changed (if any). A single edit on a Wikipedia page, thus, results in exactly one simple edit event - while several (not simple) edit events might result from one edit. To determine the edit events, WikiEvent does not even have to look at the page text - therefore the current text of any revision does not even have to be downloaded and the data collection and processing is much faster. Simple edit events are most interesting if they are computed from more than just one page (the simple edit events from one page just form a star with the page in the center), for instance on all pages that are relevant for a certain topic.
Since the page text is not necessary for computing simple edit events, it is possible to do this from history files that just contain meta-information about the page, author, and time stamp. Such stub files are provided in the Wikimedia backup dumps. For instance, to download meta-data about the complete English-language Wikipedia, follow the enwiki-link on that page, search for enwiki-<day_of_backup>-stub-meta-history.xml.gz, and download this file. On July 2, 2012 the compressed file had a size of 25 gigabyte and after unpacking it a size of more than 130 gigabyte. Such large files can be processed by WikiEvent because processing can be done in a single pass over the file. (Reading such a file from the hard disc can take a few hours but certainly less than a day with current standard desktop computers.) Note that simple edit events can also be computed from complete history files that do contain the page text.
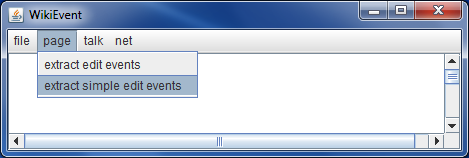
To extract simple edit events click on extract simple edit events in the page menu of WikiEvent. You have to specify a file containing the titles of pages for which edit events should be extracted (we say more on this below), a history file (which can be a stub file without page text), and an output directory. WikiEvent then creates three files in the output directory, one containing the simple edit events, one with a mapping from numerical user ids to user names, and one with a mapping from numerical page ids to page titles.
The input file with the page titles that has to be specified must contain one title per line - and nothing else. For instance, we created a file containing all page titles that include the terms social and network (for reproducability, this file is available at Media:SocialNetworkPageTitles.zip). Page titles are case-sensitive, for instance, Social network analysis points to a different page than Social Network Analysis. The first few lines of this file look like this.
 Social network
 Social networking
 Socialist Solidarity Network
 Internet social network
 Social Networking
 Social networks
 Internet social networks
 Social Science Research Network
 Socialist Organizing Network
 Social Network Analysis
 Socialist Unity Network
 ...
and the file contains 149 titles.
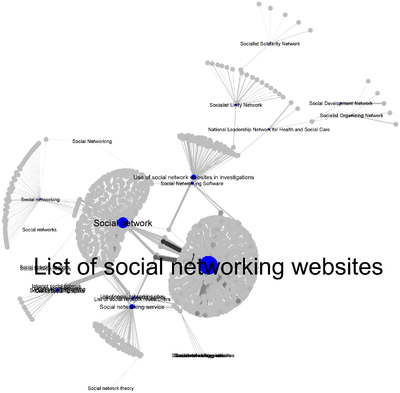
The resulting three files are available at Media:Social_network_simple_edit_events.zip. The event file Social_network_SimpleEditEvents.csv contains more than 23,000 events. It can be imported into visone in a similar way as described above (just that there are no event types and weights). A snapshot of this network in the year 2006 looks like this.
The discussion network
In principle, the extraction of edit events could be done for pages of all types - including discussion pages. However, this would not capture the fact that the editing on discussion pages follows a different logic than the editing on content pages. On discussion pages it is rather unusual that edits are made undone; on the other hand users often reply to posts of other users. To better represent the communication structure of talk pages, WikiEvent offers the possibility to extract talk events.
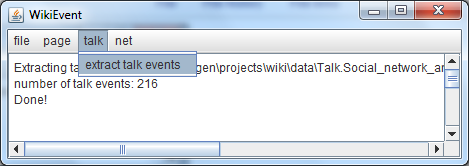
The discussion around a page is structured by discussion threads. A new thread is marked by a section headline - typically describing the subject to discuss or a question that the users wants to be answered. Other users can reply by writting their message under the same headline. After having downloaded the history of the page Talk:Social network analysis (for instance) and having extracted the talk events with WikiEvent, the first few lines of the resulting event file look like the following.
 ThreadHeadline;Time(calendar);Time(milliseconds);ActiveUser;DiscussionType;CharacterCount;IndexInThread;Target;ThreadInitiator;PreceedingAuthors...
 "== Dunbar's 150 rule ==";"2004-07-29T13:22:39Z";1091100159000;"200.225.194.49";initialized_thread;499;0;"== Dunbar's 150 rule ==";"200.225.194.49";
 "==Expansion==";"2004-10-30T06:09:59Z";1099109399000;"Goodoldpolonius";initialized_thread;321;0;"==Expansion==";"Goodoldpolonius";
 "== Dunbar's 150 rule ==";"2005-01-05T18:09:43Z";1104944983000;"AndrewGray";replied_to;274;1;"200.225.194.49";"200.225.194.49";"200.225.194.49"
 "== small world effect redirect ==";"2005-03-23T21:29:57Z";1111609797000;"Boud";initialized_thread;0;0;"== small world effect redirect ==";"Boud";
 "==Image==";"2005-03-27T05:01:50Z";1111892510000;"Goodoldpolonius2";initialized_thread;663;0;"==Image==";"Goodoldpolonius2";
 "== External links ==";"2005-04-03T01:32:35Z";1112484755000;"CesarB";initialized_thread;393;0;"== External links ==";"CesarB";
 "== External links ==";"2005-04-03T02:07:18Z";1112486838000;"Goodoldpolonius2";replied_to;458;1;"CesarB";"CesarB";"CesarB"
 "== External links ==";"2005-05-02T06:07:09Z";1115006829000;"AlanAu";replied_to;402;2;"Goodoldpolonius2";"CesarB";"CesarB","Goodoldpolonius2"
 "== External links ==";"2005-05-06T22:39:28Z";1115411968000;"AlanAu";replied_to;135;3;"AlanAu";"CesarB";"CesarB","Goodoldpolonius2","AlanAu"
 "== External links ==";"2005-05-06T22:40:30Z";1115412030000;"AlanAu";replied_to;5;4;"AlanAu";"CesarB";"CesarB","Goodoldpolonius2","AlanAu","AlanAu"
 "== External links ==";"2005-05-06T23:12:26Z";1115413946000;"Goodoldpolonius2";replied_to;232;5;"AlanAu";"CesarB";"CesarB","Goodoldpolonius2","AlanAu","AlanAu","AlanAu"
 "== External links ==";"2005-05-13T18:05:40Z";1116000340000;"82.149.68.78";replied_to;181;6;"Goodoldpolonius2";"CesarB";"CesarB","Goodoldpolonius2","AlanAu","AlanAu","AlanAu","Goodoldpolonius2"
 "== External links ==";"2005-05-22T18:22:01Z";1116778921000;"AlanAu";replied_to;365;7;"82.149.68.78";"CesarB";"CesarB","Goodoldpolonius2","AlanAu","AlanAu","AlanAu","Goodoldpolonius2","82.149.68.78"
 "== suggested additions ==";"2005-05-26T03:01:44Z";1117069304000;"AdamRetchless";initialized_thread;913;0;"== suggested additions ==";"AdamRetchless";
 ...
The file is a table encoded in a CSV file whose entries are separated by semicolons (;). The columns encode (from left to right).
- The thread headline, i.e., the subject of the discussion topic.
- The time given as a date/time string.
- Once again the time given as a number (milliseconds since January 1, 1970; see above).
- The active user which is the one who made the post.
- The discussion type of the edit which can be initialized_thread or replied_to.
- The character count indicating number of characters posted in this edit; this might be taken as a (very coarse) indicator for the amount of work invested in the post.
- The index of this post in its thread; this is a number counting the replies: 0 for the thread initialization, 1 for the first reply, 2 for the second reply, and so on.
- The target of the post. This is the thread headline if the type of the post is initialized_thread and it is the user who made the last preceeding post to the same thread.
- The initiator of the thread.
- Finally a list of all preceeding authors separated by commas (,); first the user who initialized the thread, then the user who made the first reply, etc.
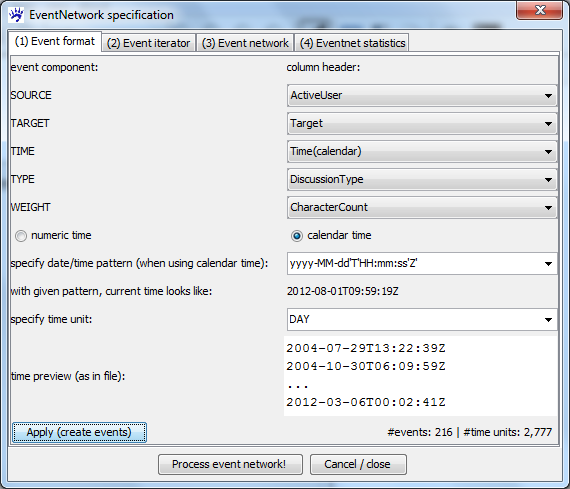
To import such a talk-event network into visone, chose files of type=event list files after clicking on open in the file menu. The settings for the cell delimiter and textframe are the same (semicolon and double-quotes). Then, as for the edit events you have to specify event format, iterator, network, and (potentially) statistics. For a possible choice on the event format see the screenshot below.
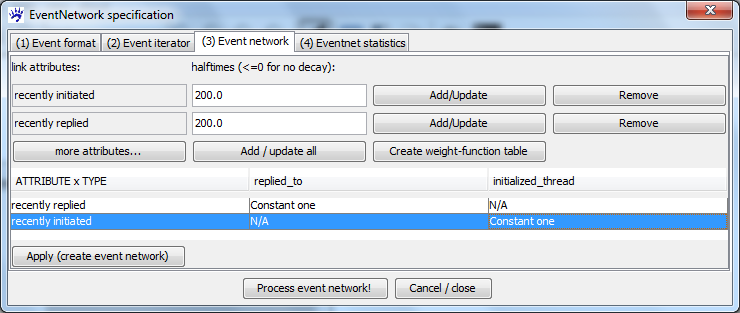
In the event iterator tab we chose to create a snapshot after every 200 days (leading to 14 snapshots). In the event network tab we create two attribute functions counting the number of initiate events or reply events and give them a halftime equal to the time span between snapshots.
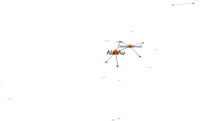
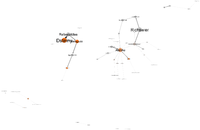
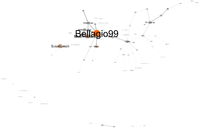
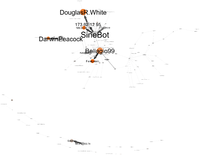
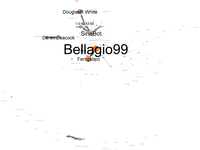
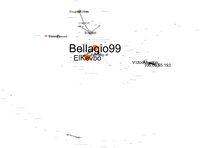
After creating the 14 snapshots, encoding involvement in the discussion by node size and number of thread initializations by color, and visualizing the network collection with a dynamic layout we can come up with the following still images (which are more interesting to view in an animation).
References
Published papers that propose and/or make use of Wikipedia edit networks include the following.
- Jürgen Lerner, Ulrik Brandes, Patrick Kenis, and Denise van Raaij: Modeling Open, Web-based Collaboration Networks: The Case of Wikipedia. In Markus Gamper, Linda Reschke, Michael Schönhuth (Eds.): Knoten und Kanten 2.0, pp 141-162. transcript-Verlag, 2012.
- Jürgen Lerner, Patrick Kenis, Denise van Raaij and Ulrik Brandes: Will they stay or will they go? How network properties of WebICs predict dropout rates of valuable Wikipedians. European Management Journal, 29(5):404-413, 2011.
- Ulrik Brandes, Patrick Kenis, Jürgen Lerner, and Denise van Raaij: Network Analysis of Collaboration Structure in Wikipedia. Proc. 18th Intl. World Wide Web Conference (WWW 2009).
More technical details about the computation of Wikipedia edit networks can be found in
- Ulrik Brandes, Patrick Kenis, Jürgen Lerner, and Denise van Raaij: Computing Wikipedia Edit Networks. Technical Report, 2009.
The techniques for modeling conditional network event types are proposed in
- Ulrik Brandes, Jürgen Lerner, and Tom A. B. Snijders: Networks Evolving Step by Step: Statistical Analysis of Dyadic Event Data. Proc. 2009 Intl. Conf. Advances in Social Network Analysis and Mining (ASONAM 2009), pp.200-205. IEEE Computer Society, 2009.
